Several years ago reformers chose to portray a large number of our schools as failures so that there would be an excuse for "reforms" such as school privatization and reductions in teacher job protections. Now that the reformer policies have been in effect for a number of years, the testing data is being manipulated to demonstrate "improvement". But such alleged "improvement" is not supported by the results of the National Assessment of Educational Progress tests (NAEP). These test results show that since 2005, Louisiana students have achieved only small improvements in national test results, and have actually lost ground compared to all other states in three out of the 4 categories tested.
Test based accountability in Louisiana has failed to make any significant improvement in student performance. At the same time our students' futures have become more limited because of the increasing emphasis on college prep for-all, at the expense of vocational prep opportunities.
The scapegoating of teachers for low student performance that has been an inherent part of the reforms has demoralized and de-professionalized the teaching profession in Louisiana. Many highly respected teachers have retired early. Meanwhile the natural joy of teaching and learning has been replaced by a constant, dull, non productive, test-prep exercise with no end in sight.
Mr Bassett's analysis
The Every Student Succeeds Act (ESSA)
requires us to revamp our school accountability system. As we decide what
changes to make, we should examine our current status, take lessons from the
history of our statewide tests, and recognize how politicized our accountability
system has become. It is imperative that we bring nuanced understanding to the
decision making process.
History warns that the results of a
single summative measure can be shaped by political considerations.
My hope here is to restore history that
John White has removed from public view and reveal the current strategy to
produce an illusion of ever-improving student performance by changing the
metrics. This link is to the GEE 21, LEAP/iLEAP, LAPARCC
and EOC data I compiled for this study.
I. The politicization of the accountability system:
Louisiana set up its accountability
system even before No Child Left Behind. The first school performance scores
were given in 1999. In 2003, the Louisiana Legislature created the Recovery
School District to take over failing schools. The definition of failure was a
school performance score of below 60. Only five schools had been taken over for
their failing status before hurricane Katrina.
Shortly after Katrina, the Louisiana
legislature arranged for the takeover of the majority of the New Orleans
schools. Act 35 allowed the Recovery School District to take over schools with
school performance scores simply up to the state average of 87.4. Only New
Orleans schools were targeted at the time. Afterward, school performance scores
became increasingly politicized.
A star rating system of schools was in
use from 2003 through 2010. A push for reforms began in the fall of 2011, when
school letter grades were instituted to create a sense of urgency. Forty-four
percent of schools were suddenly declared to
be failing because they were graded D or F. This provided momentum for the
passage of education reforms in Acts 1
and 2
of the 2012 legislative session.
Acts 1 and 2 tied tenure and teacher
evaluations to student test scores, and expanded charter schools and vouchers.
Would the changes spur increased student achievement? The reformers would soon
need evidence of improvement.
While the reform legislation was being
passed, John White, the then-new state superintendent, pushed new school
accountability formulas for 2013 through BESE. The new formulas were virtually
guaranteed to yield higher overall school letter grades.
Meanwhile, the requirement for a D was
raised by 10 points in 2012 in order to produce more Fs. This would help to
maintain the sense of urgency created the year before. But instead, good news
came at an embarrassing time for the reformers.
When the 2012 letter grades were
released, over one-third of our high schools suddenly were "A"
schools. This was due to the changeover from using the old GEE 21 to the new
End-Of-Course tests in the accountability formulas. The astounding illusion of
a turnaround appeared before the new
legislation had gone into effect.
The 2012 high school letter grade
inflation was rectified by the new accountability formulas in 2013.
The new formulas put the high school
letter grades back in linewith the 2011 results, but the K-8
schools got a huge boost. The new formulas were completely different from the
old, and the grading scale was changed from a 200 point system to a 150 point
system. Bonus points were added.
At the time, I ran the 2011 test data for each school
through the old and new formulas and found that - based on exactly the same
test data - the new formulas alone would yield much higher K-8 letter grades. This LDOE file confirms the inflationary shifts in
the 2013 results.
The 2013
LDOE press release however attributed
the improved letter grades to a slight improvement in student test scores that
year despite the reality that most of the letter grade gains came directly from
the new formulas.
"Letter grade outcomes
improved overall for the 2012-2013 school year because of record setting
student achievement: 71 percent of students tested at Basic or above this year
in ELA and math, graduation rates are at an all-time high, a record number of
students earned college-entry ACT scores this year, and Louisiana students
increased their AP participation more than any other state."
After
2013, to avoid political fallout during a time of test transition,
LDOE promised to curve the school letter grades as needed to maintain the
letter grade distribution.
The bigger picture is this. The
accountability formula changes were just one part of a planned series of
changes to guarantee rising measures that would shield the reforms from any
real scrutiny. Changes to the tests themselves were the next step.
Our test history shows that we can
expect test scores to rise simply because the tests are new. There also are
tweaks that can be made to raise or lower the scores as the political winds
change.
By
instituting the reforms hand-in-hand with radical changes to the accountability
formulas, standards, and the statewide tests, the reformers ensured there would
be no consistent measure of actual student improvement.
The
tests that existed before 2012 show slowed gains or reversals after 2012 until
they were phased out. Growth on our grade 3-8 tests slowed after 2012, and the
proficiency rates on three of our four oldest high school EOCs are currently in
decline.
The
ACT is another longstanding test on which we are in a slight decline. White
spins that a slightly higher number of students this year earned an 18 than
ever before. True, for the number as he states, but the percentage of students scoring 18 fell
nominally, by a half percent. According to the official October 2014 and 2015
multi-stats reports, the senior class this year was enough larger than last
year to make the difference.
And
this decline comes after schools have increasingly pushed students to repeat
the test until they score an 18 or higher. Some schools recently have even
required students to take an ACT prep elective until the score of 18 is
reached.
The
consistent data paint a picture of decline and it explains why the reformers
would coordinate a series of test changes and accountability formula changes
with the reform legislation. With enough changes to the metrics, there would be
no way left to tell if students really benefited from the reforms.
Soon
we will have only the reformers' spin on our statewide tests.
II. Our current status
no longer can be compared with the past:
The August 4 press release, "Louisiana
Students Show Improvement as Schools Adjust To Higher Expectations"
told us that "raised expectations" put more students at the Mastery
or above (Mastery+) achievement level. It vaguely reviewed changes to the tests
between 2012 and 2016, but did not clarify that there are simply no statistical
connections between those tests.
The "improvement" is much
better explained as a by-product of setting different curves on the totally
different tests given in those years.
At the same time state superintendent
John White released that spin, he cleansed years of test data from LDOE's
current LouisianaBelieves website. Gone are the LEAP and iLEAP results from
2008-2013. Gone are the files showing the year-to-year progress at the Basic+
level that we tracked for a decade.
The files were already up; White removed them from the website.
This was nothing new. Superintendent
White began purging test and demographic data when he replaced LDOE's former
website with LouisianaBelieves in January, 2013. At that time, fourteen years
of records were removed from public view. The limited amount of data that was
re-posted on LouisianaBelieves had much of the important information redacted.
Taking down data from public view
protects his spin from scrutiny. The latest data he removed - and then
referenced in the press release - would remind us that the test score shifts of
the last two years are totally out of line with the rest of our test history.
From 2006 to 2014, statistical test
equating ensured the year-to-year comparability of the LEAP/iLEAP tests. But in 2015, the new LAPARCC test could not
be equated to the old tests. The ELA and Math LAPARCC tests were based on new
questions developed by the PARCC consortium; a committee met to determine how
many students scored Basic and Mastery.
Still, White's press release
prominently featured a comparison of 2012 to 2016 at the Mastery+ level. The
current percentage of students at that level in ELA and Math is up 14 points
statewide.
On the other hand, my saved files show
that Basic+ dropped by three points overall from 2012 to 2016.
He does not want us to see that Basic+
fell at the same time Mastery+ rose. It would highlight the incompatibility of
the 2012 and 2016 measurements.
Since there is no statistical connection
between the 2012 and 2016 tests, it is not my point here to claim that our
students are actually doing worse. Rather, I am putting forth an example of one
way John White ensures that we get only his spin. He makes inconvenient data
disappear.
The 2015 LAPARCC was more like a
second opinion than a follow-up examination. If you are diagnosed with a
terrible disease and then get a second opinion that says you only have a head
cold, the second opinion is not evidence that you were miraculously cured.
And our 2015 LAPARCC results were
questionable at best. One of the selling points for the switch to the PARCC
test was that our scores would be compatible with other states'. It turns out they
were not. PARCC tacitly admitted that our
students had an advantage.
The official report showed us doing better than Arkansas,
New Mexico, and Mississippi, running slightly ahead of Maryland, and on several
individual tests, exceeding Illinois. But we were the only state in with a footnote
clarifying that only the pencil-and-paper version was administered. Most
students in other states took the computer-based test. Comparisons showed that, overall, students
who took the pencil-and-paper version
scored higher than expected when compared to similar students taking the
computer-based version. White remained silent about this.
Now, the legislature required a new
test for 2016 on which fewer than half of the questions would be PARCC
questions. Despite our 2015 results being unjustifiably high in comparison to
other states, scores rose even higher this year on our new LEAP tests. Whether
the gains came from level setting or merely because the tests were shortened
and scheduled later, the results were too erratic to take year-to-year
comparisons seriously as a sign of actual student improvement.
When a new standardized test is
introduced, a committee meets after the test is given. It has raw score data in
hand as it makes the judgment calls that ultimately set the curve. Existing
tests then have their curves adjusted each year through a statistical process
of test equating. The 2015 and 2016 tests introduced new curves and the changes
were extreme.
Consider the eighth grade tests. On
the 2016 tests, ELA Mastery+ was 27 points above the 2014 level. Math was 18
points higher at Mastery+ but eight points lower at the Basic+ level. These shifts are
totally out of line with our testing history.
There are six grade levels of ELA and
Math tests - twelve in total. In 2015 and 2016, record year-to-year Mastery+ gains were set on nine of those tests and two
tied for record gains when compared with the years 2006 to 2014. At the Basic+
level record losses were set on nine tests
and one tied the record.
White's spotlighting of Mastery+ while
removing Basic+ data sustains an illusion of improvement.
This goes to show how much changing
tests allows the results to be reshaped.
I should note that reshaping the results
also invalidates the year-to-year tracking of achievement gaps between
subgroups.
Suppose teacher Smith and teacher
Jones gave the same test. In teacher Smith's class, several students scored
just below an A, but only one actually made an A. In teacher Jones' class,
three students made an A, but the next highest grade was a C. By the standard
of making A's, Jones' class was better.
Smith and Jones decide to curve the
results. The curve raises four more students in Smith's class to an A, but none
in Jones' class. The grade distribution now is different; Smith's class has
more A's. This change, however, does not show improvement
in Smith's class - the raw results did not change. The curving of the grades,
not anything the students did, produced the changes.
Now say that they decided not to curve
this test, but agreed in advance to curve the next test. On the next test, the
highest scorer was still the highest, the second highest remained the second
highest, and so on. Since teachers Smith and Jones already agreed to a curve,
now Smith's class has more A's than Jones'. But again there was no real change
in performance; the results were changed by a curve which affected Smith's and
Jones' classes differently.
This would not be evidence Smith's
class closed the achievement gap, since the new curve, not a change in student
performance, made the difference.
White erred when he compared
improvement of districts at Mastery+ from 2012 to 2016 in his press release.
While I intend no disrespect to the districts cited, the data better justifies
the conclusion that the changes came from the different curves on the different
tests rather than real changes in student performance.
John White showed a similar
misunderstanding about the reduced number of failing schools when he provided
this quote for the release of the 2013 school letter grades (where the results
had just been inflated through totally new formulas, and new grading scale, and
bonus points).
“Changes made to the formula have led to real
increases in student achievement,” said Superintendent John White.
I
documented in part one that the formula change by itself yielded higher letter
grades.
So
these programmed changes to the tests and formulas are part of a strategy that
yields an illusion of improved student achievement. (Let me note here that BESE
approved these changes.)
Our grade 3-8 ELA and Math tests have
now been completely changed since 2014. A new Social Studies test was field
tested this year. Science will follow in 2018-19.
White has now proposed to change the
scoring system for our our high school EOC tests in the near future. This, too,
can result in a new curve that gives whatever illusion he desires.
White needs history to disappear
because it shows how perpetual proficiency rate gains can be created through
systematic changes to the tests. He wants us to forget these lessons so that
future gains will not be questioned.
The ruse is to change the tests and
put students at maximum disadvantage at first, then provide tweaks as necessary
to progressively increase student advantage on subsequent administrations.
Tweaks to the tests and outside
influences can increase proficiency rates. To understand this, consider the
many ways the volume I hear from my stereo can be raised.
On my home system I can turn the
volume knob, choose to play it through different speakers, or adjust the output
level of my iPod playing into the system. I can even move closer to the
speakers. An adjustment to any one affects what I hear. The original recording
is unchanged, but what I perceive is louder.
Likewise, test has a series of
"knobs" that can be tweaked to affect the results. As long as the
"knobs" are turned down on the first administration, one or more can
be turned up on subsequent administrations to continually increase proficiency
rates. Arguably, test scores can be made to rise without students truly knowing
more at the end of the year.
New-test score-rise effect: Common
sense reasons why proficiency rates on new tests rise initially then level off:
Our test history shows that
proficiency rates tend to rise for the first three to six years before leveling
off. After that, a tweak of some sort or a new test is required to spur
increased rates.
Redesigned in 2001 and 2002, the GEE
21 proficiency rates (Basic+) on each subject rose initially, but reached a
peak within three to six years. (Aside from a third year stumble in ELA.) The
gains between the initial administration and the initial peaks for the four
subjects ranged from 8 to 15 points.
Afterward, although there were ups and
downs for individual subject tests, overall proficiency peaked in 2004 and
slowly declined until 2009. (Initial gains highlighted below:) (click on the figure to enlarge it)

There are some common-sense reasons
for the new-test score-rise effect:

·
Teachers become familiar with which material is
emphasized on the test and stress it more in class at the expense of covering
other material.
·
Teachers/students develop test-taking strategies
specific to the new tests over the first few years.
·
Schools may institute test-prep strategies such
as trading class time for special test prep periods in the weeks before the
test or by requiring struggling students to take remediation in place of other
elective classes.
·
The state or district may tie test performance
to school letter grades or individual course grades, or the school might
provide trips or other rewards for desirable test scores to motivate students
to simply try harder on the test days.
The question is, do these things make
students smarter overall, or just better prepared and/or more motivated
test-takers?
The scheduling of the tests in the
school year affects the proficiency rates:
After slowly declining since 2004, the
2009 GEE 21 was scheduled about three weeks later
in the school year. Teachers and students had more time to prepare. Proficiency
rates rose on three subject tests and one held steady. On average, the increase
was four points.
Likewise, from 2006 to 2008, the
LEAP/iLEAP Basic+ rates were stagnant; the 2009 tests were moved later in the
year and the test schedule was altered
to start mid-week so that students
no longer had five consecutive testing days without a weekend break. Basic+
performance rose four points, the largest single year gain I could find.
 Now, were the students really smarter
at the end of that year than previous years, or did taking the tests later and
with a weekend break account for the higher scores?
Now, were the students really smarter
at the end of that year than previous years, or did taking the tests later and
with a weekend break account for the higher scores?

If there is any comparison to be made
between the 2016 LEAP and the 2015 LAPARCC tests, the later testing dates and
condensed schedule in 2016 would have to be taken into account. This is another
reason why any comparison between them is not valid.
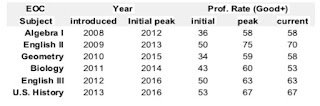
Our End-Of-Course (EOC) test history
confirms the new-test score-rise effect:
After the GEE 21 proficiency rates
stagnated, they were replaced by the EOCs, which were phased in one test per
year from 2008 to 2013. The four oldest tests, Algebra I, English II, Geometry,
and Biology have peaked and declined since their introduction. English III and
US History are still in the period of initial gains.
Scores awarded on the EOC's are Needs
Improvement, Fair, Good, and Excellent. Fair+ is the graduation requirement.
Good+ is considered proficiency.
Thanks to the new-test score-rise
effect, phasing in one test per year ensured long-term overall average
proficiency gains. As the first tests hit peaks and began to decline, later
tests made gains to offset those losses. (However, overall proficiency now has
been unmoved since 2014.) Part of White's spin is averaging the results of
several different subject tests to show sustained overall growth.
 This explains how the staggered
schedule of the redesigns of the LEAP ELA and Math, Science, and Social Studies
tests will capitalize on the new-test score-rise effect to produce sustained
overall proficiency rate gains.
This explains how the staggered
schedule of the redesigns of the LEAP ELA and Math, Science, and Social Studies
tests will capitalize on the new-test score-rise effect to produce sustained
overall proficiency rate gains.

Test outcomes have been affected by
test equating in a curious relationship;
The EOCs have evolved, but the
development of the test questions has remained under the control of Louisiana
and the testing company, Pacific Metrics. This has allowed test equating to be
performed, but some of the outcomes are interesting.
Algebra I hit a relative peak in 2012
at 56 then declined in 2013 by a point. It hit a new peak at 58 this year, but
its new peak came along with a lowered raw-score requirement.
While the Good+ rate was up, fewer
correct answers were required for Good. (25 out of 50 in 2012; 23 out of 50
were required in 2016).
Similarly, Good + on the Geometry EOC
rose every year from 2010 to 2015. Each year from 2011 to 2015, the number of
correct answers required for Good was lowered. In 2016, the required number of
correct answers was finally left unchanged; Good+ dropped by a point.
Now, there were content changes to the
tests at the same time, so the lowered requirements may have been justified.
However, it is fair to ask - are the students getting smarter, or is it simply
getting easier to make the required scores? Can we be sure that test equating
makes the year-to-year comparisons valid?
Student and school-level motivation
affects scores:
In fact, the EOC's executive summary
does caution against comparing results across years due to policy changes
connecting stakes to student performance (see page 6,
paragraph 3). The testing company warned that
outside factors can indeed influence proficiency rates.
Yet White
touted year-to-year overall gains while the scores
rose; he remained silent this year as overall Good+ showed no improvement for
the third consecutive year.
State policy linked EOC results to
students' grades and graduation eligibility beginning in 2010-2011. Needs
Improvement rates dropped by nine points that year on each of the three
existing tests and have remained close to those levels ever since. Good+ rose
by seven or more points for each test that year.
Did these gains actually reflect
increased student knowledge or did the students merely take the tests more
seriously? What gains should we expect to see if schools develop better ways to
motivate students to put forth more serious effort on test days?
Initial proficiency rates may be set
for expedience rather than actual student achievement:
When a new test is introduced, the cut
scores are set after the test is administered and the raw scores are in. But
how do we know what percentage of students should rate Basic or Mastery on a
new test?
Committees meet and set the
achievement levels using human judgment. So, how do we know that outside
influence does not creep in to the score setting process?
The first three EOCs entered with very
different initial proficiency rates (Good+). Algebra I - 36 percent; English II
- 50 percent; Geometry - 34 percent.
The initial proficiency rates of
subsequent tests, however, closely tracked the previous years' average
proficiency rates. This would be an excellent strategy to prevent a new test
from pulling the average significantly up or down.
The 2010 average proficiency rate of
the three tests then in existence - Algebra I, English II, and Geometry - was
43 percent. In 2011, the Biology EOC was introduced. At 43 percent proficiency.
The 2011 average proficiency rate rose
to 49 percent in part due to the student motivation discussed above. In 2012,
the English III EOC was introduced at 50 percent. Because of the limited number
of questions on the test, that was as closes as the new proficiency rate could
have been set to match the previous year's average.
The 2012 average proficiency rate was
55 percent. In 2013, the U. S. History EOC was introduced at 53 percent. Again,
it was as close as possible to the previous year average.
I have no "smoking gun" to
prove that this was intentional, but we have been focused on ever-rising
proficiency rates since the inception of No Child Left Behind. It also is consistent
with White's method of combining results from different subjects into one
average. I find the close correlation to be curious.
This level setting could have been
done without penalty to students because the graduation requirement is only
Fair, not the Good+ required to earn points toward the school performance
scores.
The question it raises is - how much
outside influence can be exerted on the setting of the initial proficiency
rates when new tests are implemented? To what extent can the initial proficiency
rates be shaped to produce a desired political result?
Redefining achievement levels opens
the door for outside influence:
The EOC results will be redistributed
in the future. LDOE has announced plans to
switch from the current four level system to
a five level system (Unsatisfactory, Approaching Basic, Basic, Mastery,
Advanced). The EOCs are the end of the line of the standardized tests. Students
do not need a five level system to predict performance on a future test.
This unnecessary change could raise
otherwise stubbornly immovable proficiency rates. Will the raw score required
for the new Mastery level match that required for the old Good level? The cut
points will have to be redefined, again raising the question of what political
influence might be exerted.
Furthermore, the English III EOC will
be replaced by an English I EOC, introducing yet another new test and
level-setting.
How will these changes affect overall
proficiency rates?
Switching from pencil-and-paper tests
to computer-based tests will require adjustment for our younger students:
Different formats pose different
test-taking challenges, even if the questions are the same. One
pencil-and-paper specific strategy is underlining key words or phrases in the
test booklet to refer back to. Computer-based math equation editors can be
awkward for students to use. I invite teachers to point out more examples in
the comments.
It was shown that the PARCC pencil-and-paper
version yielded higher scores than the
computer-based version nation-wide. However, the current disadvantage of the
computer-based test may dissipate as students and teachers become familiar with
the format.
It likely will take several
computer-based administrations for teachers to fully form new computer-specific
strategies and find the best ways to teach then to their students. As students
and teachers become more familiar with the format, scores should rise beyond
any actual improvement in student learning.
We are scheduled to move to
computer-based tests exclusively for grades 5-8 this year. What shifts should
we expect in this transition? Should we make allowances for schools that did
not administer the computer-based tests in 2016 different than for those that
did? What will initially rising proficiency rates really reflect - improved test
taking skills or greater knowledge?
Final questions:
History shows that scores will rise on
new tests for reasons other than actual improvements in student learning. How
much score rise should be required to show that the reforms are working and that
students have actually become smarter and are able to do more things?
How can we ensure that level setting
and adjusting is untainted by political considerations?
What safeguards should we put in place
to ensure that adjustments to the accountability formulas do not falsely
promote improved student achievement?
Should we require LDOE to maintain historical records in easy public view to
ensure transparency?
And most importantly, given that there
are so many ways the measures can be tweaked to produce continued averaged
gains, should we continue with a single summative measure of a school at all?
Herb Bassett, Grayson, LA
hbassett71435@gmail.com


